


TMT Market Report #133
China and the US agree to talk further, as new investments come from the Middle East while a late Friday downgrade of US debt by Moodys rains on the bulls parade. Let's get prepared for another week..

Welcome to The Merciless Trade, where I break down significant updates in the financial markets and find connections between them. Preparing you for the week ahead as I flip through charts, analyze the data, and cut through the noise to get an edge.
Now let’s do this…
Last weekend, the US and China sat down for talks over trade and have reached a working agreement. This followed a two-day meeting on crucial economic and trade matters for both countries. We now have tariff levels on imports from China much lower than the previous month of 135% at just 30% which is effective for the next 90 days. Essentially, this creates a deal to suspend tariff levies, as the high-level discussions continue over the next few months. Investors cheered the news, creating a sizeable gap higher in Monday’s trading sessions, which attracted more active buyers throughout the week.
We saw the S&P 500 up over 5% with the technology heavy QQQ Trust up nearly 7% as lagging market indexes like the Dow Transportation average soared higher by nearly 8% last week. These moves help put the small caps; the riskiest cohort of stocks back up to its multi-month downtrend around $210. The dollar and oil also rose, moving further from their recent lows just a few weeks ago. Yields on treasuries continued to the upside as well, with the 30-Year closing just under the critical 5% area, essentially the 2025 highs.
During the past week Trump visited the Middle East and secured over $2 trillion in deals with Gulf nations, including a $600 billion investment commitment from Saudi Arabia, a $1.2 trillion economic exchange agreement with Qatar, and $200 billion in commercial deals with the United Arab Emirates. These agreements spanned sectors such as defense, artificial intelligence, energy, and infrastructure. Also, the trip facilitated significant technology and defense collaborations. Qatar Airways announced the purchase of up to 210 Boeing jets, marking the largest order in the company’s history. Additionally, U.S. tech companies like Nvidia and AMD entered agreements to supply semiconductors to Gulf nations, aiming to bolster AI and data center capabilities in the region.

We also saw late Friday Moody’s downgrade US debt for AAA to Aa1 which marks the first time that all the rating agencies are below a AAA rating for US debt. The timing was questionable as the “big beautiful bill” that’s asking to raise the debt ceiling by 5 trillion hasn’t made it to the floor yet, as this week it didn’t even make it out of the Budget Committee. So, while the administrations and Congress are still trying to advance the bill to the floor, we have yet another downgrade of the US which could become another flash point for Congress and the “big beautiful bill”.
Looking at the economic news over the past week, we saw the PPI really surprise investors to the downside falling by -0.5% for the month much lower than the 0.2% estimate. It was declines in food and energy, which covered up some of the higher capital goods cost in the report, but overall, it was a deflationary report. That said, the drop on the services side of the report was the real reason for the decline, but with ongoing margin compression, this may reverse if companies can’t survive the hit to their bottom lines. The reality is inflation has been falling in the short-term even while we heard just this week that Walmart will be raising prices which brought sharp criticism from the President over the weekend.
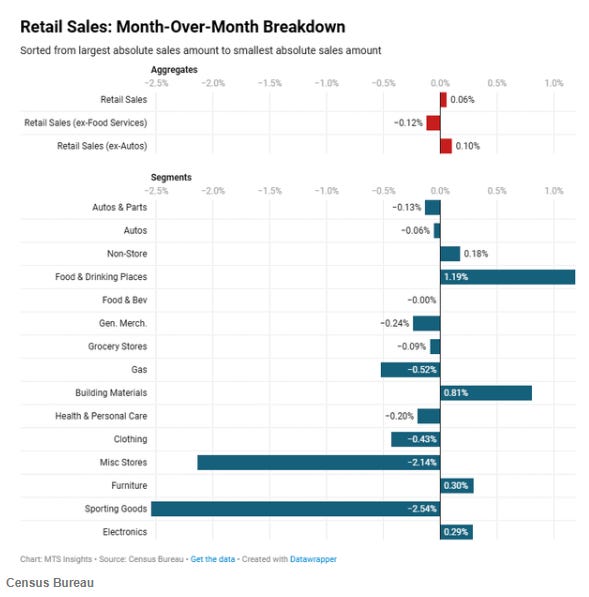
We also got retail sales last week which increased 0.1% for the month beating estimates of 0.0%. This was a sharp drop in spending over last month’s report of a 1.7% increase. While the drop shouldn’t surprise because of consumers’ front loaded purchases, the better-than-expected numbers show the continued strength of the consumer. Next month's report should give us a better read on whether the soft data, the feeling of the consumer, finally translates into the hard data, the actions of the consumer.
Here are the other economic data highlights from the past week:
Michigan Consumer Expectations (May) 46.5 vs 48.0 Est.; Prior 47.3
Michigan Consumer Sentiment (May) 50.8 Vs 53.1 Est.; 52.2 Prior
Building Permits (Apr) 1.412M Vs 1.450M Est.; 1.481M Prior
Housing Starts (Apr) 1.361M Vs 1.360M Est.; 1.339M Prior
Business Inventories (MoM) (Mar) 0.1% Vs 0.2% Est.; 0.2% Prior
NAHB Housing Market Index (May) 34 Vs 40 Est.; 40 Prior
Industrial Production (MoM) (Apr) 0.0% Vs 0.2% Est.; -0.3% Prior
Capacity Utilization Rate (Apr) 77.7% vs 77.8% Est.
Core Retail Sales (MoM) (Apr) 0.1% Vs 0.3% Est.; 0.8% Prior
Retail Sales MoM (Apr) 0.1% Vs 0.0% Expected; 1.7% Prior
Core PPI (YoY) (Apr) +3.1% vs +3.1% Est.; Prior +4%
Initial Jobless Claims 229K Vs 229K Expected; 228K Prior
Philadelphia Fed Manufacturing Index (May) -4.0 Vs -11.3 Est.; -26.4 Prior
PPI MoM (Apr) -0.5% Vs 0.2% Expected; -0.4% Prior
Gasoline Inventories 1.022M Barrel Draw Vs 0.600M Barrel Draw Est.; 0.188M Barrel Build Prior
EIA Weekly Distillates Stocks 3.155M Barrel Draw Vs 0.100M Barrel Build Est.; 1.107M Barrel Draw Prior
Crude Oil Inventories 3.454M Barrel Build Vs 2.000M Barrel Draw Est.; 2.032M Barrel Draw Prior
Core CPI (YoY) (Apr) +2.8% vs +2.8% Est.; Prior +2.8%
CPI (MoM) (Apr) 0.2% Vs 0.3% Est.; -0.1% Prior
CPI (YoY) (Apr) +2.3% vs + 2.4% Est.; Prior +2.4%
Core CPI MoM (Apr) 0.2% Vs 0.3% Expected; 0.1% Prior
- Treasury Market -
US Treasury yields continued the move to the upside last week across the curve even with a muted reaction in the 10-Year. Which was up only 1 basis point closing at 4.40%. The 2-year in contrast was up by 10 basis points finishing at 4.01% the highest weekly close since March. While the 30-Year bond yields surged by 11 basis points closing at 4.95%, which is getting awfully close to the 5% level, essentially the highs of 2025.
The 2-Year closed at 4.01%
The 5-Year closed at 4.09%
The 10-Year closed at 4.40%
The 20-Year closed at 4.93%
The 30-year closed at 4.95%
Concerning the June 18th Federal Reserve meeting, the probability of no rate cut is at 91.7% up from 82.8% in the prior, while a 25-basis point rate cut has dropped to 8.3% from a 17.2% probability.
For the July 30th meeting we have 63.2% chance up from 40% for a hold. The odds are now 34.2% that we see 25 basis points of cuts by July falling from 51.1% in the previous week. We also now see a 2.6% chance of a 50-basis point cut falling from 8.9% in the prior.
For the September 17th meeting there is now a 51.5% chance we get 25-Basis point cut up from 43.1%. While there is a 21.4% probability of seeing 50 basis points of cuts down from 39.3% in the prior week. Followed by a 1.5% chance of 75 basis points of cuts. There is also a 25.6% chance that interest rates will remain steady up from 11.1% in the prior.
- Equity Market +
The Dow Jones this past week rose by 3.41% while the Dow Transports (yellow), which has been lagging relatively for the past few months, moved higher by 7.97% crossing back over a key area around $14,700. This put the Transports back into the range it was in for all of 2024. Yet another positive sign, as some of the most economically sensitive sectors are coming back to life. The question in the coming weeks will now be how much of these gains can these indexes hold on to. If they further the advance, I think that will be a sign that investors are looking past the tariffs effect on the economy and any of the negative consequences. This would be a significant sign and one that could continue to bring under invested institutions off the sidelines. Regarding the chart below, if the Dow Jones continues to run higher and breaks free of this area around $43K, the next chart level would be at $44K. On the downside, a break just below 42K could set up a test of the 50-Day SMA around $41K.

The S&P 500 finished higher by 5.27% last week and has now risen over 20% off the lows, which to some would be the start of another bull market. I’m in the camp that new highs would officially end the bear market, but with the magnitude of this advance, it’s hard to come up with many negatives outside the markets having run too far too fast. As we are above many key technical areas, and well above the price level indexes traded at prior to the announcement of the “liberation day tariffs” on April 2nd. For me, it would take a breakdown under the 200-Day and $5700 at this point to really make me consider another leg lower. As if we stay above this area, I have to think that the bulls are in control, and it would speak volumes about how investors are feeling and looking at the current economic realities.

The S&P 400 Mid-Caps have been roaring back up by 4.82% last week after getting over the key $2900 level a few weeks ago. The index exploded higher to the next major area of resistance at $3100 this past week, crossing back over the 50—Day SMA. If the index can grind above or around 3K finding support, it would be a good sign and one that would be supportive of the recent advance. The real pivotal area that would signal a negative turn of events would break down under $2800 again.

The QQQ Trust moved higher by 6.87% this past week and had some resistance build around $520. With the markets going from one extreme to the other in just over a month we could see this rally start to slow and turn into a choppier trade in the next few weeks. Market participants will continue to closely monitor economic data which has held up better than many have believed thus far. If the index continues to trade north of $510 and doesn’t look to fill the gap around $500. We could see a further move higher develop in the coming weeks with $530, another area of potential resistance. Though my base case as of today is we settle down and start trading in a range with a likely test of gap support under and near $500 in the weeks ahead.

The Russell 2000 closed right on the trend-line and an extensive area of resistance this past Friday finishing up 4.50% last week. The relative performance is still near the low end of the range over the last few years, and this is a spot to which if the index can breakout above, we may start seeing this underperforming dynamic change as money flows back into the smaller companies. If this occurs, it will signal to me that traders and investors are really looking past the potential slowdown and taking on risk. On a pullback, we could see support around $205 near the gap or around $198/$200, which is a critical area. If the latter was to break, it would be a negative turn of events, with any price action above these levels being more constructive.

- Commodity & Dollar +
Gold this past week fell by 3.62% and landed on a key inflection area which could help signal the next move in the metal. If we break below $3150 roughly, we could see a continued move lower, with the next areas of support being $3050, $3000, and then around $2950, which is serious chart support. There is also a chance this area at $3170 acts as support which would signal possible further gains ahead in ST. That said, the RSI is weak and under 50 signaling a move lower could be probable.

The US Dollar moved higher by 0.75% and closed at $101.09 which marked the highest close in just over a month. So, the breakdown under $100 and multiyear support was brief and at this point could be likely just a knee jerk reaction based on the rollout of US tariffs and the new economic policy, which created much uncertainty.
Silver fell by 1.68% to close at $32.27 and is still in the middle of the range over the last 8 months. The commodity is currently just below its 50-Day SMA at $32.74 and above the 200-Day SMA at $31.24.
WTIC moved up by 2.41% this past week to close at $62.49 and is still below a key area around $65 that could continue to act as resistance. This is also another key watch for me as if we can regain $65 it would say a lot about how investors feel about this current rally and the global economy and demand for oil.
Copper fell by 1.20% to close at $4.55 as the RSI sits just above 50. We have seen a MACD cross develop which could signal more downside ahead. A move back over $4.90 would signal an upside continuation could develop, while a break below $4.45 could increase the sell pressure.
Bitcoin is trading at the same level as last week at 104K and is pretty much unchanged week over week. The price action looks to be setting up for an attempt at all-time highs, which I imagine could take place over the coming month.
- Sector Performance -
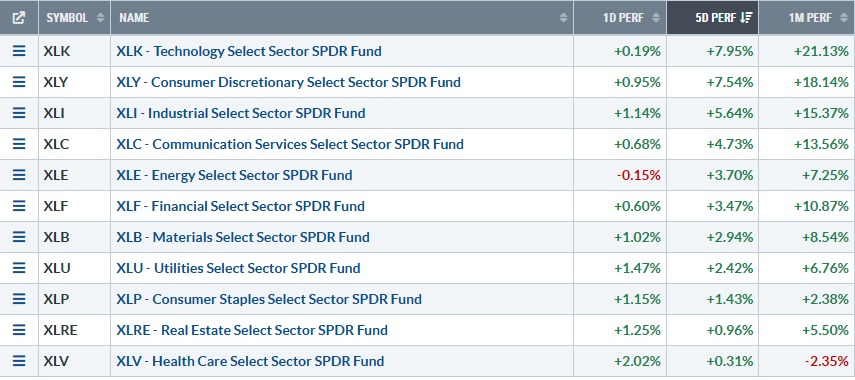
Over the past week, all S&P 500 sectors posted gains, with cyclical and growth-oriented sectors leading the charge. Technology (XLK) topped the list with a strong +7.95% weekly gain, followed closely by Consumer Discretionary (XLY) at +7.54% and Industrials (XLI) at +5.64%. Communication Services (XLC) also performed well, rising +4.73%. Mid-tier gains came from Energy (XLE) and Financials (XLF), up +3.70% and +3.47%, respectively, while Materials (XLB) added +2.94%. More defensive and rate-sensitive sectors lagged the broader rally, with Utilities (XLU) up +2.42%, Consumer Staples (XLP) at +1.43%, and Real Estate (XLRE) at +0.96%. Health Care (XLV) was the weakest performer, gaining just +0.31% for the week. Overall, the market favored growth and economically sensitive sectors this past week.
- Earnings -
This week we see key reports from Home Depot, Target, TJX, Snowflake, Paloalto, BJ’s, Deckers, Toll Brothers, Baidu, Analog Devices, Workday and Intuit among others.

- Major Economic and FED speaker highlights for the week ahead -
Monday, May 19
8:30 am – FOMC’s Bostic and Williams speak.
9:45 am – Fed Governor Jefferson speaks.
10:00 am – US Leading Index (Apr) – Expected -0.7% vs. prior -0.7%.
11:30 am – 3- and 6-Month Bill Auctions – Prior 4.300% and 4.105%.
1:15 pm – Fed’s Logan speaks.
1:30 pm – FOMC’s Kashkari speaks.
Tuesday, May 20
8:55 am – Redbook YoY – Prior 5.8%.
9:00 am – FOMC’s Barkin and Bostic speak.
9:30 am – Fed’s Collins speaks.
4:30 pm – API Weekly Crude Oil Stock – Prior +4.287M.
5:00 pm – FOMC’s Kugler speaks.
7:00 pm – FOMC’s Daly speaks.
Wednesday, May 21
7:00 am – MBA Mortgage data: 30-Year Rate 6.86%, Applications WoW +1.1%, Purchase Index 166.5, Refinance Index 718.1
10:30 am – EIA Oil Inventory Data:
• Crude +3.454M
• Cushing -1.069M
• Gasoline -1.022M
• Distillates -3.155M
• Heating Oil +0.292M
• Production & Refinery: Gasoline -0.327M, Distillate -0.069M
• Refinery Utilization +1.2%
• Crude Imports +0.422M
• Refinery Crude Runs +0.330M12:00 pm – FOMC’s Barkin speaks.
1:00 pm – 20-Year Bond Auction – Prior 4.810%.
Thursday, May 22
8:30 am – Jobless Claims:
• Initial Claims 227K (prior 229K)
• Continuing Claims 1.881M
• 4-Week Average 230.5K8:30 am – Chicago Fed National Activity Index (Apr) – Prior -0.03.
9:45 am – S&P Global PMIs (May prelim):
• Manufacturing 49.9 (prior 50.2)
• Services 50.7 (prior 50.8)
• Composite 50.610:00 am – Existing Home Sales (Apr): 4.15M vs. prior 4.02M; MoM -5.9%.
10:30 am – Natural Gas Storage – Prior +110B.
11:00 am – KC Fed Manufacturing Index (May) -5; Composite Index -4.
11:30 am – 4- and 8-Week Bill Auctions – Prior 4.220% and 4.235%.
12:00 pm – 10-Year TIPS Auction – Prior 1.935%.
2:00 pm – FOMC’s Williams speaks.
4:30 pm – Fed Balance Sheet – $6.713T; Reserve Balances – $3.236T.
Friday, May 23
8:30 am – Housing Permits (Apr): 1.412M vs. prior 1.467M; MoM -4.7%.
10:00 am – New Home Sales (Apr): 696K vs. prior 724K; MoM prior +7.4%.
12:00 pm – Fed Governor Cook speaks.
1:00 pm – Baker Hughes Rig Count.
3:30 pm – CFTC Positioning:
• Crude Oil +185.3K
• S&P 500 -122.2K
• Nasdaq 100 +19.5K
• Gold +161.2K
• Silver +47.8K
• Copper +21.5K
• Natural Gas -112.1K
• Corn +18.1K
• Soybeans +65.2K
• Wheat -118.1K
- Conclusion -
This past week we continued to see technical strength as markets roared higher on the heels of easing of China tensions and new areas of growth coming out of middle east investments for many technology companies. We also saw strength in many economically sensitive sectors such as transportation stocks, all while the VIX, a measure of volatility, closed just above 17, marking the lowest close since late March. Investors have become increasingly bullish on the rollback of tariffs as indexes are currently in striking distance of new all-time highs. Forward looking price to earnings multiples on the S&P 500 are back above 21 at 21.4X. While this is a historically well above the 30-year long-term average of 16X, it’s below the multiples achieved during the Dot-Com Bubble 25X and Pandemic peaks of 24X.
In the week ahead, we very well could see a pullback develop with the news of the downgrade from Moody’s this past Friday. The selloff, or lack thereof, should show how markets participants are thinking about the sharp rally off the lows. If we don’t see a considerable pullback develop after such a massive move off the lows, it could be because of many investment firms being on the wrong side of this trade needing to get exposure to stocks. That said, I still expect a test of the QQQ Trust around $500 as my base case, potentially filling the gap from the past week, but it could take some time to develop.
The week of May 19–23, 2025, is packed with Federal Reserve commentary and a broad mix of economic indicators that could shape market sentiment. Monday kicks off with a flurry of Fed speakers—including Bostic, Williams, Jefferson, Logan, and Kashkari—alongside the April Leading Index, which is expected to remain in contraction at -0.7%. On Tuesday, Redbook will gauge retail activity, and energy traders will watch the API crude inventory build, as more Fed speeches continue. Wednesday centers on housing and energy markets, with MBA mortgage data and crude oil inventories. Thursday brings a key batch of macro data: jobless claims, home sales, natural gas storage, and a closely watched update on U.S. manufacturing and services via the S&P Global PMIs, which are hovering near stagnation. Friday concludes with the release of April housing permits and new home sales data, and speculative CFTC positioning data will be released during the final hour of trading. Overall, the week is rich with signals on economic momentum, labor health, and Fed policy direction.
Well, that’s it for this week. Have a good one. Take care.
Eric
You likely receive hundreds of pitches.
This isn’t one of them.
Hello @Mosaic Asset Company,
Share deep respect for what you have built here.
I am the Founder and Steward of the 100x Farm.
The 100x Farm is a quiet strategy sanctuary for investors and capital stewards with long memories and longer horizons.
No noise. No dopamine. No trend-chasing.
Just deep-cycle clarity earned slowly, shared rarely.
We don’t believe in inbox conquest.
But if the idea of sowing $10,000 seeds to harvest $1 million trees over 20- 30 years feels familiar,
you and your patrons may already belong here.
What if the next 100x isn’t a stock but a forgotten business model hiding in plain sight?
Every thesis is backed by real capital, filtered through over 100 long-cycle lenses before it earns a word.
And if nothing else, this may help you filter what isn’t worth your time.
No urgency. No ask.
Only signal.
Warmly,
The 100x Farmer