


TMT Market Report #141
Markets are responding to the President's new tariff announcements, set to take effect on August 1st, just as Q2 earnings season kicks off. Another significant week lies ahead.

Welcome to The Merciless Trade, where I break down significant updates in the financial markets and find connections between them. Preparing you for the week ahead as I flip through charts, analyze the data, and cut through the noise to get an edge.
Now let’s do this…
This past week we saw two dozen letters being sent out to countries all over the world with formal tariff declarations from the U.S. that are set to start on August 1st. We also saw the President on Saturday formally declare tariff’s rates of 30% on Mexico and the EU. While there will be a 35% rate on Canada also set to kick off August 1st. On top of that, Trump put a 50% tariff on copper this past Wednesday, sending the metal up over 10% initially and to new all-time highs around $5.50. While the tariff deadline got pushed to August 1st, we saw a wide range of tariff rates changes coming out of the administration as policy looks to be finalized in the coming weeks.
This gave markets pause as indexes consolidated near the recent highs, taking the news in stride, but still all major markets finished the week in the red. As has been the case for the last few months, markets by in large looked past the threats but with the magnitude of the advance from the April lows and overbought conditions prevailing in markets, we could see investor sentiment around tariffs and upcoming earnings reports weigh on equities. That said, it will be the strength of the earnings reports coupled with the forecast that should create the tailwind for the next move. I expect solid earnings reports, but we should see companies having to decide around preserving margins and/or raising prices. This could create some volatility but if we see the economy continue to coast without a serious economic slowdown, we should see stocks indexes continue to trade above the prior highs.

Last week we had a successful 10-Year treasury auction while we once again saw initial jobless claims come in below expectations at 227K. We also saw the release of the Fed minutes and at potential turning points in interest rate policy we can see the importance of these statements going up a few notches. There were a couple of participants that would be open to cutting rates in July if the data support it, and the economy progressed as expected. The reality is though if the trajectory holds and economy doesn’t strengthen, along with inflation over the next few weeks and months, September is when I expect the first rate cut. On the flip side if we see inflation pick up the next two reports as the job markets strengthens, I think these potential cuts will get pushed out yet again.
Here are the other economic data highlights from the past week:
Federal Budget Balance for Jun $27.000B vs $(41.500B) Est; Prior $(316.000B)
Initial Jobless Claims 227K vs 236K Est.
Continuing Jobless Claims 1,965K Vs 1,980K Est.
10-Year Note Auction for Jun 4.362% vs 4.421% Prior
52-Week Bill Auction 3.925% Vs 3.940% Prior
Crude Oil Inventories 7.070M Barrel Build Vs 1.700M Barrel Draw Est.
Gasoline Inventories 2.658M Barrel Draw Vs 1.700M Barrel Draw Est.
EIA Weekly Distillates Stocks 0.825M Barrel Draw Vs 0.300M Barrel Draw Est.
Wholesale Inventories (MoM) For May -0.3% Vs -0.3% Est.
Consumer Credit (May) 5.10B Vs 10.40B Est.
52-Week Bill Auction 3.925% Vs 3.940% Prior
NY Fed 1-Year Consumer Inflation Expectations (Jun) 3.0% Vs 3.2% Prior
CB Employment Trends Index (Jun) 107.83 Vs 107.49 Prior (Revised To 107.83 Prior)
Baker Hughes Oil Rig Count -1 To 424; U.S. Baker Hughes NatGas Rig Count Unchanged At 108; U.S. Baker Hughes Total Rig Count 537
- Treasury Market -
Yields moved higher across the curve with the 10-Year benchmark up by 6 basis points closing at 4.41%. While the long end and the 30-Year were more active with a 10-basis point rise. With the 2-Year only rising by 2 basis points, closing the past week at 3.91%. The interest rate curve once again saw higher yields as bonds prices continued to fall.
The 2-Year closed at 3.91%
The 5-Year closed at 3.98%
The 10-Year closed at 4.41%
The 20-Year closed at 4.95%
The 30-year closed at 4.96%
Concerning the July 30th Federal Reserve meeting, the probability of no rate cut is at 94.8% falling from 95.3% in the prior, while the odds of a 25-basis point rate are at 5.2% rising from 4.7%.
The probability of a hold at the September 17th meeting is 39.6%, an increase from 30.6% the week before. The odds are now 57.4% that we see 25 basis points of cuts by September falling from 66.2% in the previous week. We also now see just a 3% chance of a 50-basis point of cuts.
For the October 29th meeting there is now a 47.1% chance we get 25-Basis point cuts up from 43.4%. While there is a 34.4% probability of seeing 50 basis points of cuts down from 43.6%. Followed by a 1.7% chance of 75 basis points of cuts. While we saw a rise to 16.7% that, interest rates will remain steady with no rate cuts up from 11% in the prior.
- Equity Market +
The Dow Jones Industrial Average was lower by 1.02% closing at $44371.51 as the Transportation average in yellow was higher by 1.01%. This relative strength from the economically sensitive stocks that make up the transportation index is a sign that this rally is durable. On the chart below and regarding the Dow Jones, we have all-time highs around 45K. Given last week’s pause in price action, we may see a similar pattern develop in the coming weeks. Nevertheless, I believe we will see new all-time highs at some point, but as we start another earnings season watching investors sentiment around these reports and company’s outlooks will be a dominate theme the next few weeks.

The S&P 500 the past week moved down by 0.31% to close at $6259.75. We have chart support at $6150 with the 21-EMA crossing the price action around the same level currently. With any pullback I expect this area to be a considerable support and the bulls to dig in. RSI has dipped back under 70 as Friday we saw a pullback in stocks with Thursday marking another record high for the index. Above $6150, the $6200 level could also provide support. If we break down under these two support levels, the trend will be tested, and a breakdown at $6150 could create a sharp move in the index down to $6050.

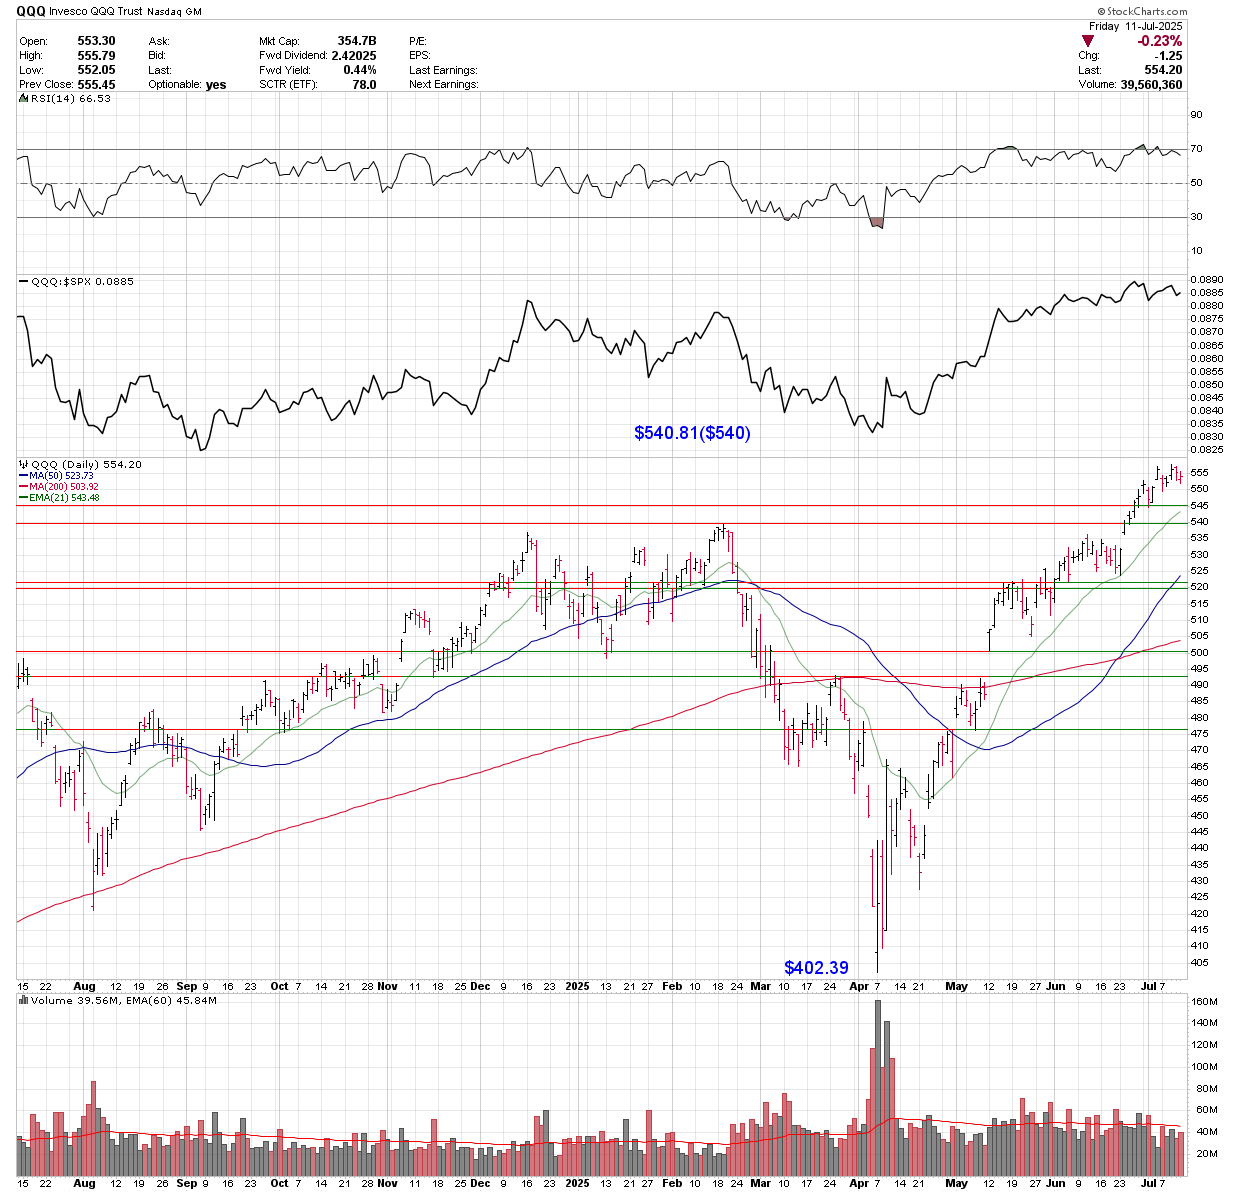
The QQQ Trust moved lower by 0.36% closing at $554.20 this past week as MSTR, AMD, and PLTR saw relative strength and were the top three performers in the index. On the flip side, it was TEAM, DDOG, and ADSK that saw the most selling in the index falling to the bottom. There is immediate support at $552 and below that, around $550. These levels could be in play this week on any pullback, with $545 acting as support on any break below $550. There also is the rising 21-EMA that could be supportive currently at $543.48.
The Russell 2000 moved lower by 0.62% closing at $221.70 after stalling at $226.05 this past Thursday, which was the highest level for the index since February of this year. We have support now around $218 with the 200-Day SMA around $215 currently. Although small caps have outperformed for a couple of weeks, sustained relative momentum hasn’t occurred since last year. Nevertheless, the trend in the index is in motion to the upside, and if we don’t break back under the 21-EMA, we could see a move to test $230 over the next few weeks.

- Commodity & Dollar +
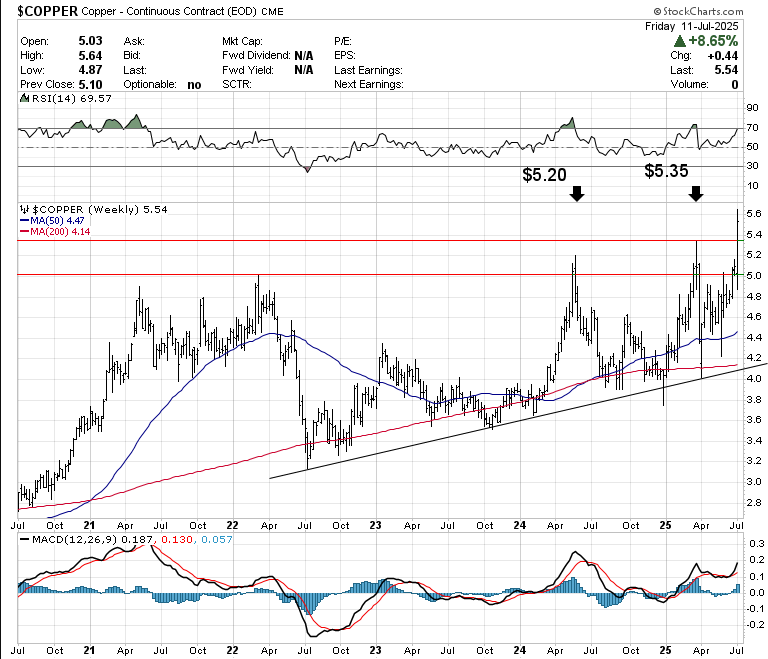
Copper this past week exploded on the heels of the announcement of a 50% tariff on the metal this past Monday. This was higher than the markets expectations which aided in the magnitude of the move with copper settling up by 8.65% to close at $5.54 a pound. We could see the old highs near $5.35 act as support on any pullback but with the possibility these tariffs take effect on August 1st copper should continue to move higher.
Bitcoin was a standout this past week exploding to new all-time highs with a roughly 8% move trading just under 118K currently. Momentum is clearly to the upside with the trend from April still in motion. MACD is rising off the zero bound as RSI is above 70 signaling relatively overbought levels. With the breakout though I expect more highs in the coming weeks before any serious correction. That said if we do pullback, we should see support near the old highs around 112k.

The U.S. Dollar found some traction with a 0.71% move higher closing at $97.87 on the index. The 50-Day SMA is at $98.88 which has been a indicator the dollar has been trading under since early 2025. A change in this dynamic could be one of the first indications the dollar is in the throes of a counter rally.
WTI crude oil moved higher by 2.87% to close at $68.75 after continuing to move off the $65 support area over the course of the past week. We have seen global supply rising fast as U.S. energy firms have now lowered the amount of gas rigs for the 11th straight week.
Gold this past week moved up by 0.86% closing above its 50-Day SMA at $3354.76 after a brief move under over the past few weeks. RSI is turning up around the 50 level with $3500 the recent highs from April of this year.
Silver broke higher in a big way this past week moving up by 4.13% closing at $38.37 an ounce which marked a new 52 week high. Support may now be found near $37.50 on any pullback with the 21-EMA acting as support on any break below currently around $36.50. That said, I expect more highs as my base case before any serious pullback develops.
- Sector Performance -
Over the past week, the Energy sector (XLE) led with a +2.41% gain, followed by modest strength in Utilities (XLU) and Industrials (XLI). Technology (XLK), Financials (XLF), and Communication Services (XLC) lagged, all posting losses near or above -1.8%. Health Care (XLV) and Materials (XLB) also saw declines, while Consumer Discretionary (XLY) was close to flat. Despite the mixed weekly performance, most sectors remain positive over the past month, with Technology up +6.63%, and Industrials, Materials, and Energy all gaining over 4%.

- Earnings -
Traditionally the kickoff week for the earnings season the week ahead features key Q2 earnings from major financials and blue chips. Tuesday kicks off with reports from JPMorgan, Citi, Wells Fargo, and BlackRock. Wednesday brings ASML, Bank of America, Goldman Sachs, Johnson & Johnson, and Morgan Stanley. Thursday is headlined by TSMC, PepsiCo, Cintas, Abbott, and Netflix after the close. Friday wraps with 3M, American Express, SLB, Truist, and Regions. Other notable names include Fastenal, United Airlines, Alcoa, and Prologis, making it a pivotal week for market direction.

- Major Economic and FED speaker highlights for the week ahead -
Monday, July 14
🕓 11:30 – 3-Month Bill Auction, prior 4.255%
🕓 11:30 – 6-Month Bill Auction, prior 4.145%
Tuesday, July 15
☀️ 07:00 – OPEC Monthly Report
☀️ 08:30 – CPI (YoY Jun) +2.6%, Core CPI (YoY) +2.8%; both MoM +0.3%
☀️ 08:30 – NY Empire State Index (Jul) -7.8 vs prior -16.0
🕓 09:15 – FOMC Bowman speaks
🕓 11:00 – Cleveland CPI (MoM) +0.2%
🕓 12:45 – Fed Vice Chair Barr speaks
🕓 13:00 – FOMC Barkin speaks
🕓 14:45 – Fed Collins speaks
🌙 16:30 – API Crude Oil Inventories +7.1M
🌙 19:45 – Fed Logan speaks
Wednesday, July 16
☀️ 07:00 – MBA Mortgage Rates 6.77%, Apps +9.4%
☀️ 08:30 – PPI (YoY Jun) +2.6%, Core PPI +3.0%, both MoM +0.2–0.3%
🕓 09:15 – Industrial Production (MoM) +0.1%, Capacity Utilization 77.4%
🕓 10:00 – Fed Vice Chair Barr speaks
🕓 10:30 – EIA Crude Oil Inventories +7.07M; Gasoline -2.658M
🕓 14:00 – Fed Beige Book
🌙 16:30 – FOMC Williams speaks
Thursday, July 17
☀️ 08:30 – Jobless Claims: Initial 234K, Continuing 1.965M
☀️ 08:30 – Retail Sales (MoM Jun) +0.2%, Core +0.3%, Control +0.4%
☀️ 08:30 – Import Prices (MoM) +0.2%; Export Prices (YoY) +1.7%
☀️ 08:30 – Philly Fed Index (Jul) +0.4 vs prior -4.0
🕓 10:00 – NAHB Housing Index 33 vs 32
🕓 10:00 – FOMC Kugler speaks
🕓 10:30 – Nat Gas Storage +53B
🕓 11:30 – 4- and 8-Week Bill Auctions
🕓 12:45 – Fed Daly speaks
🕓 13:00 – Atlanta Fed GDPNow Q2: 2.6%
🕓 13:30 – Fed Gov. Cook speaks
🌙 16:00 – TIC Data (May): Net Long-Term Transactions -$7.8B
🌙 18:30 – Fed Waller speaks
Friday, July 18
☀️ 08:30 – Housing Starts 1.29M (MoM -9.8%), Building Permits 1.39M (MoM -2.0%)
🕓 10:00 – Michigan Sentiment (Jul) 61.4 vs 60.7 prior; Inflation expectations 1Y: 5.0%, 5Y: 4.0%
🕓 11:30 – Atlanta Fed GDPNow Update
🕓 13:00 – Baker Hughes Rig Count: Oil 424, Total 537
🌙 15:30 – CFTC Speculative Positions (Gold +203K, Crude +209.4K, S&P -140K, Nasdaq +31.2K, Silver +58.5K)
- Conclusion -
This was the week markets have been waiting for as July 9th was the date tariffs would have gone back to their “liberation day” rates. That didn’t happen, but we saw the President send out letters and announce new rates for two dozen countries over the past week. This gave investors pause with the market taking a wait and see approach to any new announcements as the selloff remained contained in prior week’s ranges. The strength in the equity market over the past few months could give Trump some room to increase the pressure like he did this past week. So, I expect new tariff threats before we see a slew of deals that hopefully get inked in the coming weeks. As the longer we see policy remaining uncertain, the less likely, the Fed will act in the short-term by lowering rates. While Trump continues to apply pressure on Powell, he has yet to rekindle the possibility of firing him. Powell and the Fed have remained resolute in waiting for any uptick in inflation before acting. If we don’t see inflation pick up in the coming weeks and months with as tariffs rates become more known, I think the Fed will surely lower rates in the fall.
The week of July 14, 2025, features critical U.S. economic data, earnings releases, and Fed speak, headlined by Tuesday’s CPI release, which is expected to show inflation accelerating to 2.6% YoY, and core CPI rising to 2.8%. PPI data follows Wednesday, reinforcing the inflation read-through with a 2.6% YoY gain expected. Both these readouts will be critical for the Fed and if we see inflation below expectations on a MoM basis, rate cuts odds should move up quite a bit for September. Economists forecast a modest rebound in Thursday’s retail sales following May’s contraction, while jobless claims remain elevated at 234,000. Housing starts and permits close the week Friday, both projected to weaken. The Fed is highly active throughout, with speeches from Barr, Logan, Williams, Daly, Waller, and others, plus Wednesday’s Beige Book offering regional insight ahead of the next FOMC. Energy markets will watch the OPEC report and EIA inventories, while positioning data Friday rounds out a market-sensitive week. This week will mark the start of Q2 earnings reports as investors will be laser focused on earnings and how companies are navigating the current environment.
Thats it for this week. Have a good one everyone.
Eric
🙏🔥