TMT Market Report #24
As the Economic data rolls in the slowdown looks underway but will it continue?
We started the past week on a positive note for the equity market. However, as the economic data readouts continued to point to a slowing economy, the bond and equity markets pivoted on the news as traders repositioned. Yields collapsed as the data points pointed to an economy slowing sooner rather than later; the equity market did sell off, but the disconnect between what stock traders and the bond traders expect is just about as wide as it has been. Then we got the Friday Non-Farm Payroll data which beat analyst estimates for the last 12 months at 236k compared to a 230k consensus estimate.
The whisper number on the street was considerably lower, and this number is more in tune with market participants’ expectations. Also, this 12-month data is compiled by Bloomberg as Benzinga had the average estimate at 240k. So this would be a miss, regardless the data came in hotter than what traders were expecting and went against the week's trend of a cooling economy. Also, the unemployment rate dipped to 3.5% from 3.6% in March. That being said, the Nonfarm data will lag behind the claims data, as the claims are week to week and as current as the data could be.
Notably in this week’s claims numbers are the revisions from the last week of March, which adjusted the 198k claims number to 248k. This is significant, and even though they dropped to 228k week over week, the adjustments point to a slowdown as unemployment is starting to tick higher. Also, continuing jobless claims were 1.823M compared to the 1.69M expected. These will be essential data readouts for the week ahead, and while the CPI will be the main show, these have increasing relevance. The gap between what the bond market and stock market are predicting is vast, and these economic data points could close that gap in a hurry if they continue to point to a slowing economy.
In other economic readouts, on Tuesday, the JOLTS job opening and labor turnover study came in at 9.93M compared to the 10.5M consensuses and was the smallest since April 2021. The S&P PMI for March was 52.3 compared to the 53.3 consensus estimate. Also, the Services PMI came in at 52.6 compared to the expectations of 53.8, and the ISM Non-Manufacturing PMI For March was 51.2 compared to the 54.5 consensus estimate. Besides the Nonfarm Payroll on Friday, the week’s economic data readouts were weaker than expected. Tuesday also saw US manufacturing near a 3-year low as the PMI for March came in at 46.3 compared to 47.7 in February, and the new orders index tumbled to 44.3 from 47.0 in February. This signals the ongoing contraction in US manufacturing in stark contrast to the hot US service sector.
The prior week we saw yields that had stabilized, but yields moved lower again this past week and now have the 10yr trading on a support level and in an area essentially signaling a significant slowdown by the summer. This past week we also continued to see a stunning yield inversion in 3 months/10yr to 160 basis points as of Thursday morning. This is the FEDs preferred recession indicator, as the FED prefers the 3-month/ 10yr spread better than the 2yr/10yr spread. Weakness in yields this week brought back the likelihood of 100 basis points of cuts for 2023, but that eased Friday with the Payroll data as yields on the 2yr closed up nearly 20 basis points just on Friday to finish the day at 3.9930%. The 10yr rallied back ABOVE the support zone in the chart below, as this chart doesn’t have the data from Friday, as the equity market was closed. The 10yr ended the week at 3.413%, and if yields start Monday on a similar note, this should give the equity market some support early in the week. A severe breakdown of yields here would signal a recession, possibly starting or imminent.
Banks kick off earnings season this Friday, as Blackrock, JP Morgan, Wells Fargo, PNC Financial, and United Health(Not a bank) will report. Friday is generally considered the unofficial start of earnings season; Delta will report earnings on Thursday before the market opens. However, that’s not all, as traders’ eyes will be on regional banks, where much attention has been lately. First Republic Bank will be reporting on Tuesday before the market opens. So this week’s earnings could hold some surprises, and even bank analysts don’t know what’s on a bank’s balance sheet till they do. So the market participants will parse through these reports for any hints of ongoing stress and spillover from the banking crisis. Below is a 30-minute monthly view of the S&P Regional Banking index, and you can see how precariously low the index is heading into earnings season. I imagine these regional banks will continue to weigh on the markets longer-term, as they will have smaller periods of outperformance in the short term. Still, the regional banking sector should often lead selling to the downside.
Looking at the S&P 500, we backtested the early March highs this week and ended the week closing at $4105.02, a considerable way away from $4000. With the slate of economic news releases this week, fireworks should be expected. I adjusted these pivots slightly for this week to fit the ever-changing landscape better. I’ll use $4140.00-$4148.50 and $4184.0-$4195 on the S&P 500 and $412-$413 and $415.75-$416.75 on the SPY.
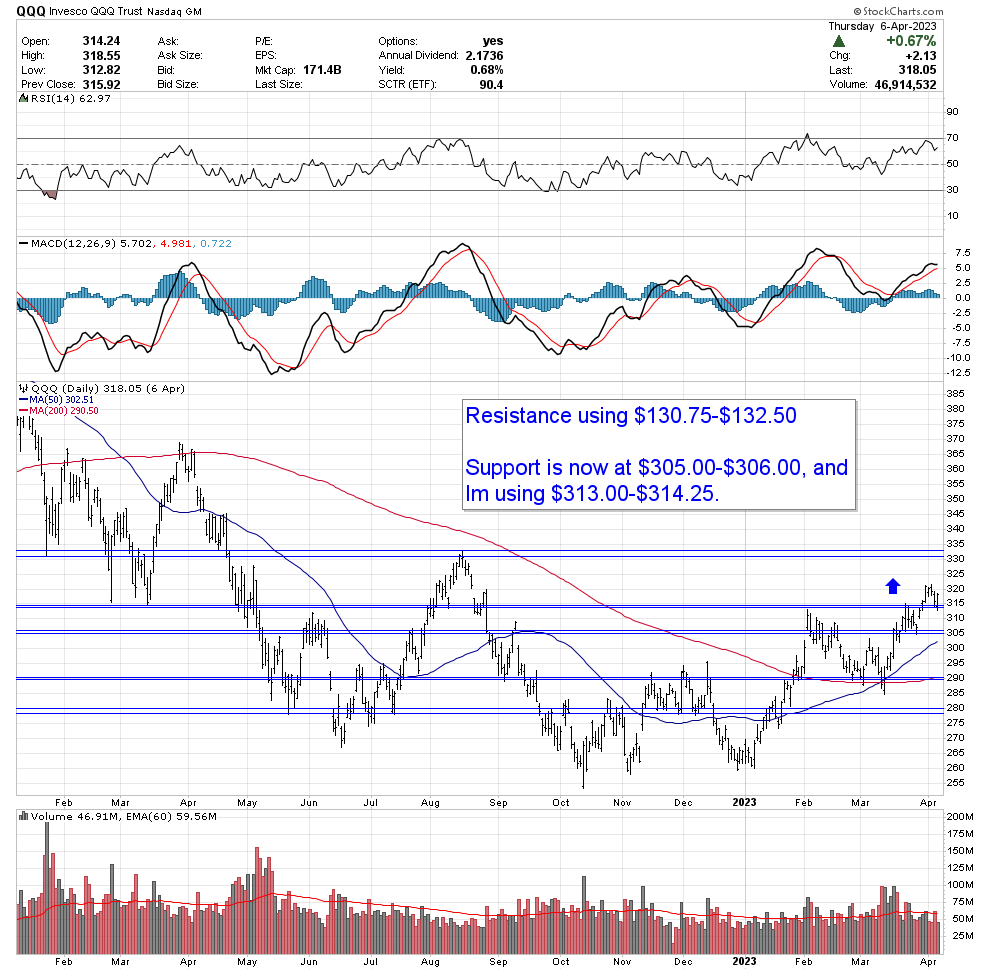
Looking below is a chart of the tech-heavy Nasdaq’s QQQ Trust; in the chart below of the QQQs, our pivot at $113.50-$114.25 was tested on Wednesday and Thursday last week. A breakdown under $313 this week should be viewed as a cautionary sign as I feel consolidation should, by in large, take place over $313, or the uptrend in place should continue to move higher toward the $330 area.
Glancing at the 30-minute chart below, you can see the pivot we have been using was tested on Friday but held, and within an hour, the QQQ Trust was back above and closed the week on solid footing.
The Nasdaq Composite is also at a critical junctor. A continued move here will confirm the rally, and visa-versa; if the index cannot get over $12250, it can be seen as a negative concerning the strength of the current equity rally of 2023.
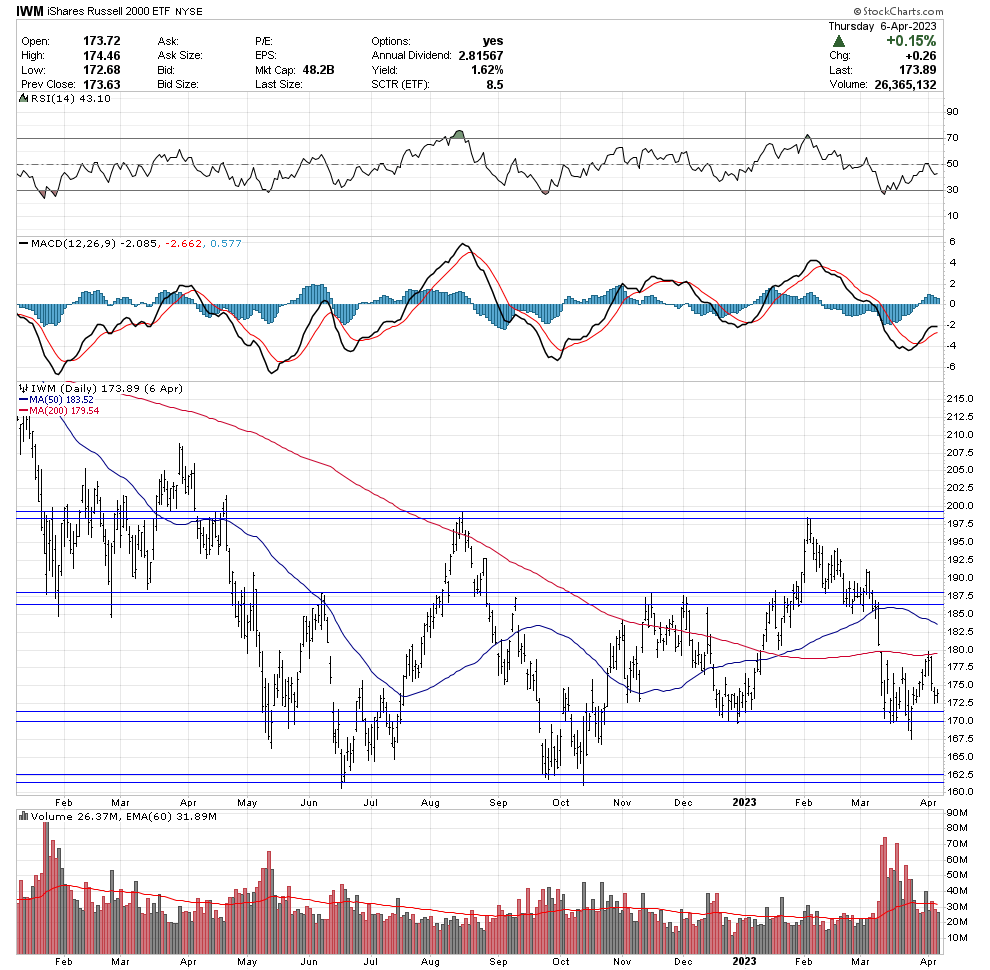
I am watching for cracks here as the Russel 2000 has been weak since the banking crisis, and a significant break under $170 should be met with considerable selling. We successfully tested support two weeks ago, but this past week failed to get over the 200-day SMA and finished noticeably weak. This index could continue to be a downside leader and indicate if the economy is sliding fast into a recession, as the index is weighted toward small caps.
OPEC + surprised the market with a cut of more than 1 million barrels a day to start the week on Monday, jolting the oil market higher, and then WTIC traded in a pretty tight range over the week. I’m watching Oil in the week ahead for another leg higher. I would imagine traders are just waiting here for more data to roll in before they make more bets on the future Oil price. The gap to the downside is a possibility to get filled, and if the data continues to point to a slowdown, that could very likely happen. If we sit in a void, though, where the economy keeps chugging along, albeit slower than previous months, and the data comes in mixed, this may keep the price of Crude elevated. Also, a significant factor is a global economy grappling with high inflation and how this situation ends, on top of China reopening and the possibility for pent demand continuing to buffer the weakness elsewhere.
Notable on the week:
Over the last five trading days, the sector leaders XLV HealthCare was up 4.24%, XLU Utilities was up 3.88%, and XLC Communications up 3.60%.
Laggards were XLI Industrials falling by -2.09, XLY Consumer Discretionary by -0.49%, and XLK Technology, up 0.13%.
The Dollar is right on a critical support level, as is the story in the bond market also. A breakdown here should lead to increased selling of the Greenback.
Gold had a monster week, setting up a possible run to new all-time highs. Much of this could ride on how and when this economy turns south. If the trend continues this week and gold consolidates above the $185.50-$186.50 area. I see no reason why Gold wouldn’t take a run at new all-time highs in the weeks and months to come. With the continued uncertainty around the path of rates and the possibility of something else breaking, these factors should keep Gold elevated for the foreseeable future as the technical picture is solid.
The KRE S&P Regional Banking index has been fragile since the banking crisis started in early March. Here you are looking at a 30-minute chart over the last month. I want to give some perspective on how little the bounce was recently and how weak the index has been. If this pivot area at 41.25-41.50 is breached multiday, a break under 40 dollars is what to expect, as the next pivot I’m using is at $37.75-$38.75.
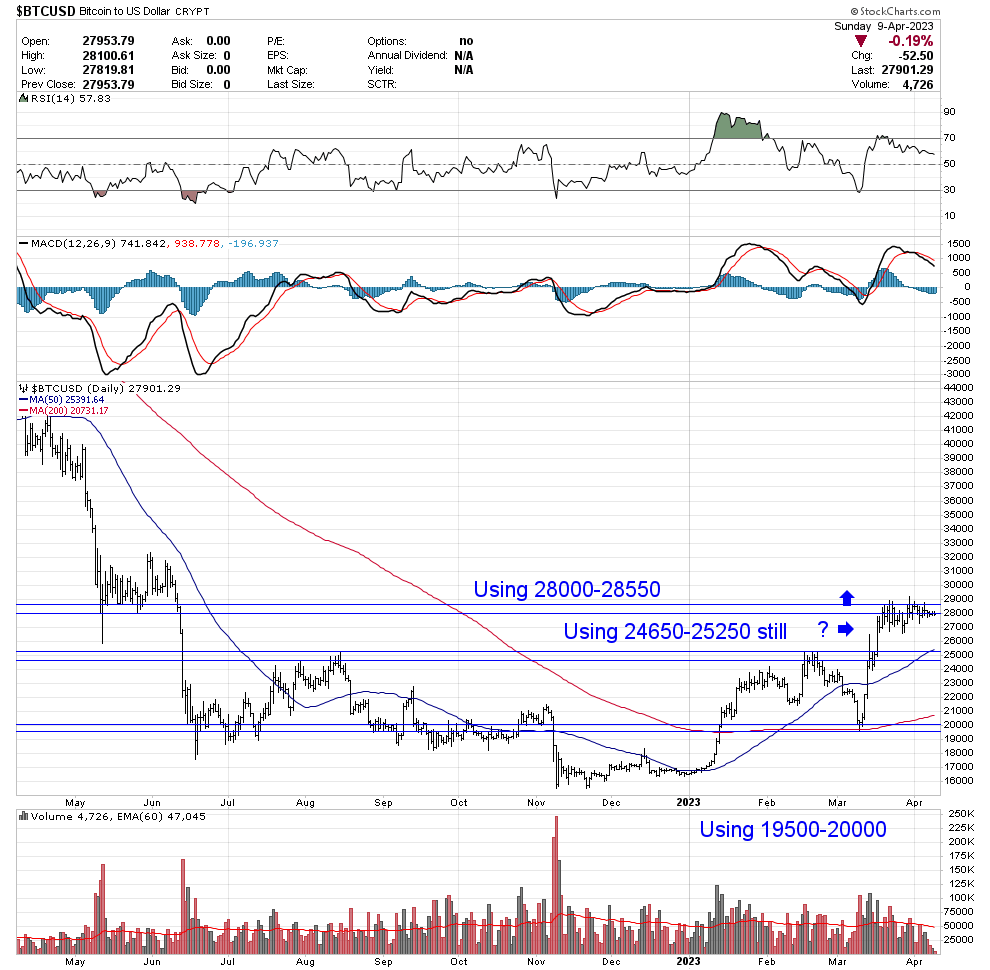
Bitcoin has been in a relatively tight consolidation range over the last few weeks at our $28000-$28550 pivot area. I expect Bitcoin to follow if we have a significant breakout in equities.
Major Economic and Fed Speaker highlights for the week ahead are as follows:
Monday, April 10th - 10 am Wholesale Inventories(MoM0(Feb) - Consensus 0.2%
10 am CB Employment Trends Index(Mar) - Consensus ? Previous 118.29
11:30 am 3-6 Month Bill Auctions
4:15 pm FED Williams speaks
Tuesday, April 11th- 6 am NFIB Small Business Optimism(Mar) - Consensus??
12 pm EIA Short-Term Energy Outlook
12 pm WASDE report
1 pm 3 yr Note Auction
4 pm FOMC Harker speaks
4:30 pm API Weekly Crude Oil Stock - Previous -4.346 Million
7:30 pm FOMC Kashkari Speaks
Wednesday, April 12th - 8:30 am Core CPI(MoM)(Mar) - Consensus 0.4%
8:30 am Core CPI(YoY)(Mar) - Consensus 5.5%
8:30 am CPI(MoM)(Mar) - Consensus 0.3%
8:30 am CPI(YoY)(Mar) - Consensus 6.0%
10:30 am Crude Oil inventories - Consensus -2.329 Million
11 am Cleveland CPI(Mom)(Mar) - Consensus ? Previous 0.6%
1 pm 10yr Note Auction
2 pm Federal Budget Balance(Mar) - Consensus -256.0 Billion
2 pm Fed Minutes
Thursday, April 13th- 7 am OPEC Monthly Report
8:30 am Initial Jobless Claims - Consensus 205k Previous 228k
8:30 am Core PPI(MoM)(Mar) - Consensus 0.3%
8:30 am Core PPI(YoY)(Mar) - Consensus 3.3%
8:30 am PPI(MoM)(Mar) - Consensus 0.1%
8:30 am PPI(YoY)(Mar) - Consensus 3.1%
Friday, April 14th - 4 am IEA Monthly Report
8:30 am Core Retail Sales(MoM)(Mar) - Consensus -0.3%
8:30 am Export Price Index(MoM)(Mar) - Consensus -0.2%
8:30 am Import Price Index(MoM)(Mar) - Consensus -0.2%
8:30 am Retail Sales(MoM)(Mar) - Consensus -0.4%
8:45 am Fed Waller speaks
9:15 am Capacity Utilization Rate(Mar) - Consensus 79.0%
9:15 am Industrial Production(MoM)(Mar) - Consensus -0.2%
10 am Bussiness inventories(MoM)(Feb) - Consensus???
10 am Michigan Consumer sentiment(Apr) - Consensus 67.0
10 am Michigan Consumer Expectations(Apr) - Consensus 64.5
10 am Michigan Current Conditions (Apr) - Consensus - 70.0
1 pm US Baker Rig Count - Oil Previous 590 Total Previous 751
4:30 pm CFTC Crude/Gold/S&P/Various Commodities speculative net positions
In conclusion, the Bulls pushed back when they needed to this week and finished on a strong note on Thursday as the equity market shrugged at the higher claims data even with higher revisions, all while buying stocks into the close. With the better-than-expected Non-Farm Payroll data again on Friday(Equity Closed) this past week, bond yields rose considerably(Half day). So I feel the equity market should get off to a strong start on Monday but with CPI on Wednesday and PPI and jobless claims on Thursday. I expect a significant move by the end of the week, and I’m not sure that this will be an up move(55%), but if the support pivots continue to hold as they did on the QQQ Trust this week. The Bulls will still have the upper hand the longer the economy weakens without a recession. Moving forward, markets will continue to be all about the data points, and if the trend continues this week, pointing to a slowdown. I expect the Bears will show up in full force.
Well, until next week, I hope you enjoyed my free weekly TMT Market Report, and don’t forget to check out my weekly TMT Stock Report later this evening.


Great update. Thanks!