


TMT Market Report #63
TMT Market Report #63
The new year brought big moves in the Dollar and bond yields as the equity market took a much needed breather. Is this just a hiccup or a sign of something bigger brewing?

So, this week we saw an immediate change in sentiment to kick off the new year, which, as I had said previously, is not that uncommon. It still is jarring and can take a bit to adjust to, but from a trading perspective, the market was weak most of the past week after only finishing in the green on Friday. Which was not the strongest of days also as the day before the Fed minutes showed the Fed talking about rate cuts in the second half of the year. By in large, equities reacted well to the news and data this week, considering that we expected a substantial pullback after the magnitude of the rally we have seen in 2023. At the end of the week, though, it was not even a contest as the streak of consecutive weekly gains ends at nine.

Analyzing the economic news of the previous week, we saw once again Jobless Claims come in below expectations at 202K while the Friday employment report showed wage increases across the board. The headline non-farm number ticked higher at 216K, albeit not as much as the headline would suggest with revisions. Job openings with the JOLTS number stayed relatively steady with 8.790M openings for November as the ISM Non-Manufacting PMI came in well below estimates. Also, the ISM non-manufacturing employment number at 10 am Friday came in much weaker at 43.3 compared to the 51.0 that was expected. The question really is, does the economy continue to weaken or do we see a pickup in inflation or dare I say economic activity into the summer?
According to the Bureau of Labor Statistics’ December jobs report, non-farm payrolls (NFPs) experienced a growth of 216,000 in the last month of 2023. This marked an improvement from the downwardly revised 173,000 reported in November and exceeded the expected figure of 170,000.
December Jobs Report: Key Highlights
Alongside the NFP data, the December jobs report revealed a steady unemployment rate at 3.7%, below the expected 3.8% .
The pace of annual wage growth strengthened, with average hourly earnings rising 4.1% compared to December 2022, up from November’s 4% pace, and above estimates of 3.9%.
On a monthly basis, the average hourly earnings saw a 0.4% rise, in line with November’s rate and above the anticipated figure of 0.3%.
Here are the other economic data highlights from the past week:
Nonfarm Payrolls (Dec) +216K vs +170K Est.
U6 Unemployment Rate (Dec) 7.1% Vs 7.0% Prior
Unemployment Rate (Dec) 3.7% Vs 3.8% Est.; 3.7% Prior
Dec. Participation Rate 62.5% vs 62.8% Est.
S&P Global Services PMI (Dec) 51.4 Vs 51.3 Est.; 50.8 Prior
Crude Oil Inventories A Draw Of 5.503M Vs A Draw Of 3.200M Est.; Draw Of 7.114M Prior
Initial Jobless Claims 202K Vs 216K Est.; 220K Prior
ADP Nonfarm Employment Change (Dec): + 164K vs +115K Est.
JOLTs Job Openings (Nov) 8.790M Vs 8.850M Est.; 8.852M Prior
ISM Non-Manufacturing Employment (Dec) 43.3 Vs 51.0 Expected
ISM Manufacturing Prices (Dec) 45.2 Vs 47.5 Expected, 49.9 Prior
ISM Manufacturing (Dec) 47.4 Vs 47.1 Expected, 46.7 Prior
ISM Manufacturing Employment (Dec) 48.1 Vs 45.8 Prior
Atlanta Fed GDPNow For Q4 2.0% Vs 2.3% Est.; 2.3% Prior
Construction Spending (MoM) (Nov) 0.4% Vs 0.5% Est.; 1.2% Prior
S&P Global US Manufacturing PMI (Dec) 47.9 Vs 48.2 Est.; 49.4 Prior
Durables Ex Defense MoM(Nov) 6.5% Vs 6.5% Prior
Factory Orders MoM(Nov) 2.5% Vs 2.1% Expected, -3.6% Prior
ISM Non-Manufacturing PMI(Dec) 50.6 Vs 52.6 Est.; 52.7 Prior
Looking at bonds they had a monster surge to open the New Year with the 10-year bond up just under 20 basis points on the week hitting a major resistance area on Friday with the job’s numbers coming in above expectations on a few fronts. We have to monitor how this situation develops over the next few weeks, as the data could continue to give credence to the idea that Fed will have to stay higher for longer. As long as the possibility of rate cuts just get moved out a few months we should be in for a garden variety pullback. The real negative that could shock equities and the bond market further would be if the Fed needed to raise rates again. That is a long way off, and the more likely scenario as of now is rates just staying higher for longer. As the bar for raising rates again is really high at this point for the Fed.

- Earnings -
We have yet another milestone already in 2024 as this week it’s the kickoff to earnings season as the major banks are set to kick things off. The most anticipated earnings releases for this week are JPMorgan Chase, Tilray, UnitedHealth, Delta, Bank of America, Citi, Wells Fargo, Aehr Test Systems, BlackRock, Acuity Brands, and Accolade.

- Equity Market +
Now, while we have seen considerable selling over the past week, we are a way off of any kind of test to the uptrend, as you can see in the weekly chart below. We have a solid support area around $4600 and above, and the trend is still around $4400, while the 50-day SMA is about $4540. So, while we saw a big move lower last week on the index by -1.52% we still have a strong uptrend and just a pullback at this point is what I’m expecting. Below is a weekly chart of the S&P 500.

Looking at the Nasdaq Composite, which finished down -3.25% on the week, we have settled on an important pivot area, and this should help give some direction for the markets over the next few weeks. As if in the week ahead we breakdown further here it would be a broad negative for the pace of the current multi-month rally we have been in. Now the QQQ Trust, not pictured today by comparison, is still above a critical pivot area around $390 as the 50-day SMA sits around $386. Over the past week, the QQQ Trust finished lower by -3.12%.

The Russell 2000 has broken back down under a major pivot which kept a lid on the Index for well over a year. I can’t stress the importance of regaining this pivot area, as while we have seen a move through the $197-198 pivot area in December, we would like to see the Russel come back and regain this area. Otherwise, the rally we have seen will probably not go much further. This is an important area of focus of mine. If the soft-landing rally is to push much further, we need to see small caps leading relatively again like they did the past two months. A pullback and change that has taken place this week is fine, as we had a historic run the last two months. What we need to see now over the first half of the year if we are going to continue moving higher is the Russell 2000, in the simplest form, getting back over our pivot and $200. Over the past week the Russel 2000 was down by -3.72%.

- Commodity Update +
Gold on the week finished down by just over -1% to end the week at $2049.80.
Silver also saw a strong pullback closing lower by on the week by -2.62%.
Copper continued to trade under the important resistance area around $3.95 as the losses accelerated into the end of the week as the base metal hit $3.80 on Friday. Hitting the 200-day SMA before closing a tick higher at $3.81 on the week, falling by -2.27%
The Dollar found support where we would expect, as the overshoot of $100 in July seems to be just that. That being said, although the Dollar moved higher by 1.09% over the past week, we still are deep in the red technically and still have many more weeks like the one we just have seen to put the greenback on a sound technical footing. As of now, we look likely to trade between $100-$103, but if this changes and the Dollar keeps moving higher over the next few weeks, it will probably continue to pressure equities.

Looking at oil over the week, the commodity was one of the biggest gainers. We saw a 3.01% move higher with higher lows being set withing an important pivot area. This is a technically a prominent sign and, as of now, supports the thesis of higher oil prices into the first quarter. That being said, a breakdown under $70 again should raise the red flag pretty high. For that reason, crude and the XLE continue to be a major focus on mine in the trading week ahead.

- Notable on the week -
Over the last five trading days, the sector leaders were:
XLV Healthcare was up 2.01%
XLU Utility was up by 1.89%
XLE Energy was up 1.00%
Laggards over the same time period were:
XLK Technology, down -4.34%
XLY Consumer Discretionary, down -3.46%
XLI Industrial, down by -2.25%
Kicking off the new year, we saw relative strength and a breakout in the XLV Healthcare with the biggest gains out of the 11 sectors we track here hitting a new multiyear high as well.
XLF continued to make new multiyear highs on both Thursday and Friday. While there were considerable pullbacks in both the XLY Consumer Discretionary and XRT Retail.
Looking at the XLK over the past week, the biggest loser, we have pulled back under an important pivot area and the trading around this level will be a critical area to watch in the weeks ahead. Does the XLK regain $187, or does the index continue moving lower, testing the 50-day SMA and the $180 pivot area? I have a short-term negative bias until some of these indexes regain important areas, as the pullback that started with the new year should still have some momentum yet. If this isn’t the case, I expect to see the XLK regain the $187 level in the next week or two.

- This week in great chart setups -
Last week COR up 2.91% MSFT down -2.20% TYL Down -4.14% while RIVN outright collapsed on poor guidance that was released early last week down -18.67%.
This week I choose 4 stocks from the S&P 100 to highlight.
ABBV - Company will be trading Ex-Dividend this upcoming week on January 12th with a 3.82% annual yield and the next earnings report will be on February 2nd.
DIS - Flagging and holding above the moving averages as the RSI looks primed for a possible move. Company has a small dividend, 0.66% and will be reporting earnings sometime in February. One of my main watches this week.
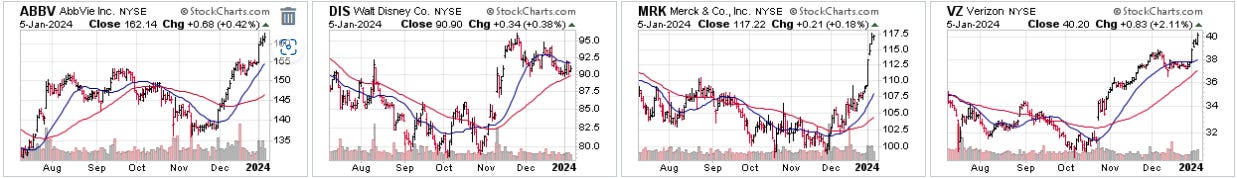
MRK - Breaking out on a total return chart. Company has a healthy 2.96% dividend yield last traded Ex-Dividend on December 14th with a February earnings date ahead.
VZ - Company will be trading Ex-dividend this week on January 9th with a monster 6.62% annual dividend. Next earnings report will be on January 23rd. Another main watch for me in week ahead. Stock is breaking out to 52-week highs on total return chart.
- Major Economic and FED speaker highlights for the week ahead -
Monday, January 8th
10 am CB Employment Trends Index - Consensus?? Prior 113.05
11 am Consumer Inflation Expectations - Consensus?? Prior 3.40%
11:30 am 3/6 Month Bill Auction - Prior 5.295%
1 pm 2-year/5-year Note Auction
3 pm Consumer Credit (Nov) - Consensus 10.35B Prior 5.13B
Tuesday, January 9th
8:30 am Imports - Consensus?? Prior 323.00B
8:30 am Exports - Consensus?? Prior 258.80B
8:30 am Trade Balance (Nov) - Consensus -64.50B Prior -64.30B
12 pm EIA Short-Term Energy Outlook
1 pm 3-Year Note Auction
4:30 pm API Weekly Crude Oil Stock - Consensus?? Prior -7.418M
Wednesday, January 10th
8:30 am Wholesale Trade Sales (MoM)(Nov) - Consensus?? Prior -1.3%
8:30 am Wholesale Inventories (MoM)(Nov) - Consensus ?? Prior -0.4%
10:30 am Crude Oil Inventories - Consensus ?? Prior -5.503M
1 pm 10-Year Note Auction
3:15 pm FOMC Member Williams Speaks
Thursday, January 11th
8:30 am Continuing Jobless Claims - Consensus ?? Prior 1855K
8:30 am Initial Jobless Claims - Consensus ?? Prior 202K
8:30 am Core CPI (YoY)(Dec) - Consensus ?? Prior 4.0%
8:30 am Core CPI(MoM)(Dec)- Consensus 0.3% Prior 0.3%
8:30 am CPI (YoY)(Dec) - Consensus ?? Prior 3.1%
8:30 am CPI (MoM)(Dec) - Consensus 0.2% Prior 0.1%
10:30 am Natural Gas Storage - Consensus Prior -14B
11:30 am 4-week/8-week Bill Auction
1 pm 30-Year Bond Auction
2 pm Federal Budget Balance (Dec) - Consensus?? Prior -314.0B
4:30 pm Fed Balance Sheet - Consensus ?? Prior 7,681B
4:30 pm Reserve Balances with Federal Reserve Banks - Prior 3459T
Friday, January 12th
8:30 am Core PPI (MoM)(Dec) - Consensus 0.2% Prior 0.0%
8:30 am Core PPI(YoY)(Dec) - Consensus ?? Prior 2.0%
8:30 am PPI (MoM)(Dec) - Consensus 0.2% Prior 0.0%
8:30 am PPI(MoM)(Dec) - Consensus 0.2% Prior 0.0%
12 pm WASDE Report
1 pm US Baker Hughes Rig Count
3:30 pm CFTC Various Speculative Net Positions
- Conclusion -
What can we say about the first week of the year, almost like that light switch got turned on and the market just came with a different thesis in 2024? The data was in line with what we have been seeing. It’s just that every week that goes on with the data not continuing to deteriorate at a steady clip. Has given the market’s pause, a step back as traders and investors readjust their outlooks with trading in both the dollar and bonds frantic last week. The question is where from here and does this sentiment shift become a trend?
That brings us to another week of important readouts, as this week we get CPI and PPI on consecutive days. CPI has been crucial for the bull's theory of a soft landing. If this dynamic was to change materially, it would further strengthen the Dollar and weaken bonds further, driving yields higher.
We find ourselves at a bit of a crossroads to start the year. We have seen considerable progress on inflation over the last few months, but there has been an economy, led by services, that has defied expectations at a steady pace in 2023. My thinking is the excess liquidity created through the pandemic with our monetary policy, coupled with a slow start of interest rate increases from the Fed in regard to inflation in 2022. On top of an economy that has received an enormous boost from various stimulus packages and bills, including the Chip Act. So much of a boost that I believe the US economy seemly could continue to defy all expectations in 2024.
So, we need to monitor the incoming data points and use the trends we see, or not see, to help us gauge how much the economy is really pulling back. As if we continue to see an economy that defies expectations, while it’s true it is slowing currently, the bar for a rate cut is much higher than what the market currently has priced in. That said, if we don’t see material weakness in February, I see no reason for a rate cut in March. My best guess currently would be a June/July timeframe as much more probable time for the Fed to start cutting rates. The reality though, is time and data will likely be the true judge.
We’ll have a great week of trading, investing, and working. Take care. Be good.
Eric