


TMT Market Report #64
TMT Market Report #64
Rate hike odds cool for March, as CPI comes in hot while the PPI report ends the week on a cool note. Will this lead to a record close on the S&P 500 in the week ahead? Let's discuss.

Over the past week, we have seen the bulls push back hard after being drubbed in the first week of trading of 2024. Odds for a March rate cut increased once again after a slew of economic numbers kept the soft-landing thesis in front and center of traders and investors’ minds. While the January meeting is all but certain, a hold at 94.8%. March is still much less certain. In the past week though, we saw the odds move up from 64% a week ago to currently 76.9% odds of a rate cut.
So, we have had a bit of a reversal from the trading in the bond market over the previous week, which saw yields rise at the fastest pace in quite some time. This week we saw nearly half of that move in the Fed fund futures market reverse course as the market rallied hard on the week with the Nasdaq finishing up over 3% and the S&P 500 over half of that. Now the Dow Jones Industrials barely made it out of the week in the green as the Boeing news of a door flying off a Max 7 weighed heavily on the Index, but it still wasn’t enough to create a crash landing.

Looking at the economic calendar over the past week, we saw once again initial claims near the 200k mark coming in at 202K. While headline CPI ticked higher only to finish the week with a lower PPI print. This is the back and forth you get whenever data point is being closely scrutinized and run through the market’s various competing thesis’s. Mind you, that the latter will go into forecasting the PCE number at the end of the month. This could give yet another favorable inflation readout in the next few weeks as estimates will be lower than previously expected as economist factor in the PPI numbers to their PCE forecast. Now let’s dive deeper into the CPI report from last week.
Key Highlights from the December Inflation Report:
The annual CPI inflation rate rose to 3.4% in December 2023, up from the previous 3.1% and exceeding the expected 3.2%.
On a monthly basis, the CPI increased by 0.3%, surpassing the expected 0.2% and accelerating from November’s 0.1%.
The annual core CPI inflation rate slightly decreased to 3.9%, down from November’s 4% but still above the expected 3.8%.
On a monthly basis, the core CPI increased by 0.3%, in line with November’s figures and economist predictions.
In December, the shelter index continued its upward trajectory, showing a 0.6% month-on-month increase, which accounted for more than half of the overall monthly price rise. Looking at the yearly basis, the shelter item registered a 6.2% increase.
The energy index saw a 0.4% increase, marking its first monthly uptick since September. This was driven by higher electricity and gasoline prices, which more than compensated for the decline in the natural gas index.
The food index recorded a 0.2% increase in December, mirroring the same increase observed in November.
Here are the other economic data highlights from the past week:
PPI (MoM) (Dec) -0.1% vs +0.1% Est.
Core PPI (MoM) (Dec) 0.0% Vs 0.2% Expected, 0.0% Prior
PPI (YoY) (Dec) 1.0% Vs 1.3% Est.; 0.8% Prior
Initial Jobless Claims 202K Vs 210K Est.; 203K Prior
CPI (YoY) (Dec) 3.4% Vs 3.2% Est.; 3.1% Prior
Core CPI (MoM) (Dec) +0.3% vs +0.3% Est.
CPI (MoM)(Dec) 0.3% Vs 0.2% Est.; 0.1% Prior
Core CPI (YoY) (Dec) +3.9% vs +3.8% Est.
Natural Gas Storage -140B Vs -119B Est.; -14B Prior
Wholesale Inventories (MoM) (Nov) -0.2% Vs -0.2% Est.; -0.4% Prior
Crude Oil Inventories Build Of 1.338M Vs Draw Of 675K Est.; Draw Of 5.503M Prior
EIA Weekly Distillates Stocks A Build Of 6.528M Vs A Build Of 2.382M Est.
USA Exports 253.70B Vs 258.80B Prior
USA Imports 316.90B Vs 323.00B Prior
NFIB Small Business Optimism (Dec) 91.9 vs 90.7 Est
CB Employment Trends Index (Dec) 113.15 Vs 113.05 Prior
Turning our attention now to the bond market we saw a considerable pullback in yields, and strength in bonds this week with the 10-year off nearly 10 basis points on the week. This was after the PPI on Friday showed inflation coming in cooler than had been expected, leading to a considerable pullback in yields to finish the week. The short end of the curve saw considerable buying as the 2-year saw a massive pullback in yields off by just about 25 basis points on the week. While the long end of the curve, the 30-year bond saw a modest rally to finish lower by a handful of basis points on the week. Pictured below is a daily chart of the 10-year bonds yield.

- Earnings -
Before the bell Tuesday, we get Goldman, Morgan Stanley and PNC, followed by Interactive Brokers and Pinnacle Financial Partners in the evening. Wednesday, we get Charles Schwab, Prologis, US Bancorp and Citizens. That evening we see key reports from Alcoa, Discover, Wintrust, and Kinder Morgan. While the next morning we get Taiwan Semiconductor, Fastenal, Key Bank, Northern Truist, and First Horizon. Thern Thursday evening we get reports from PPG Industries, JB Hunt, First National and Bank OZK. Wrapping up the earnings reports for the week on Friday morning, we get SLB, Huntington, Ally, Travelers, State Street and Regions Financial.

- Equity Market +
Looking at the S&P 500 on the weekly chart this is a crucial area and is a make-or-break moment for the S&P 500 as a breakout here could see the bull run pushing on to the phycological 5k area in the next few months. This past week we saw a move above $4800 on a gap higher on Friday morning being met with selling, but the bulls remained vigilant, driving the index up by 1.84%. This week I would bet on higher highs with a new closing high on the S&P 500, with potentially an all-time high following in short order. Why?
Well, after we got through last week’s crucial economic reports, as the technical picture improves the odds of a further rally have increased in my estimations. In the week ahead, I’m using $4730-4740 as the first major pivot, with Friday’s lows being another area I’m watching. If by any chance equities sell of hard in the week ahead, the $4700 area has been in play of late and just below that is a solid area of support. That being said, a move over $4800 in the week ahead should see the odds of a breakout rise drastically. The upcoming week is going to be crucial for market direction.

The Nasdaq Composite bounced off a key support level last week with the low being $14560.20 settling right in the middle of our pivot before a considerable move higher on the week by 3.09% to finish at $14972.76. So far, the major test of support has been a success as the 10-week moving average added to the support around $14500.

The QQQ Trust this past week saw a solid move higher, finishing up by 3.23% as the CES, Consumer Electronics Show added a strong tailwind at the back of AI companies this past week. As many of the key players in the space showed off, and highlighted their progress and products related to AI, which was the major theme of CES this year. In the week ahead, I will look out for continued support around $405 on the QQQ Trust. If this area was to come under pressure, this would be a clear warning sign. On the upside, I’m watching the trading around $411-412.50 to give some sign of potential for the move ahead.

The Russell 2000 was weaker than the other major averages, even weaker than the Dow finishing the week essentially flat down a basis point -0.01%. We can consider the pullback a cautionary sign as the Russel has pulled back in relative terms. The major breakout above our pivot has led to the sellers regaining control after pushing lower in the last two weeks. The pivot area saw strong selling, causing the big rally the index had on Friday to result in a weak close. This continues to be a major area of focus of mine as the odds of the rally going on week over week, month over a month without the Russel breaking back above essentially $200 are low. The continued surge, or lack of in small caps over the next few months, should be a great indicator to watch regarding the strength of the breakout in the major averages. While the rally we have seen since November last year could surely use a breather, the bulls want to see the market rally reaching new heights and for that to happen; we need to see the Russel outperform again.

- Commodity Update +
Copper this week broke down under its 50-day and 200-day SMA going out on the lows, near a month low at $3.74 finishing off by -1.72% on the week.
Gold kept its head above water but just barely finishing the week higher by 9 basis points or 0.09% to finish the week at $2051.60.
Silver over the past week saw a gain of 0.06%
Taking a look at WTIC we have continued to form a base trading just above our pivot area and the crucial $70 a barrel area.

The Dollar did what Gold and Silver did, which was to settle very close to where the week started. During the week, the index finished higher by just 0.02%. A move lower at this point is still just as likely as ever, while we bounced to start the year, we still have to see the technical picture improving which would include at some point a break back over the 200-day at around $103.50. In contrast, if support was to break at around $100, it would be a major change with economic ripples throughout the system as investors and traders reposition.

- Notable on the week -
Over the last five trading days, the sector leaders were:
XLK Technology was up 4.41%
XLC Communication Services up 2.46%
XLP Consumer Staples was up 1.10%
Laggards over the past week were:
XLE Energy down -2.36%
XLU Utilities down -1.88%
XLB Materials down -1.06%
XLC hit another record in the previous week while finishing Friday at a 52-week closing high for the Index. XLY Consumer Discretionary pulled back on a major support level as Tesla, a major player in the sector, was down all week. The XLK which pulled back under a major level in the first week of trading, reversed course running higher by over 4% and is once again nearing a record high. The question here is does the area act as resistance?? Remember, the S&P is also approaching a record level. If we don’t breakout, the next move will be a further pullback.
- This week in chart setups -
Last week’s charts:
MRK was higher by 1.20%
ABBV was up 1.12%
DIS was lower by -0.61%
VZ fell -2.46% last week.
This week’s stock where all from the S&P 500
AMZN - The warehouse giant will be reporting earnings in a few weeks and is at multiyear highs after a strong surge last week.
ISRG - Company makes various surgical equipment for physicians and doctors, primarily for surgeries as the company has with an earnings date of January 23rd.
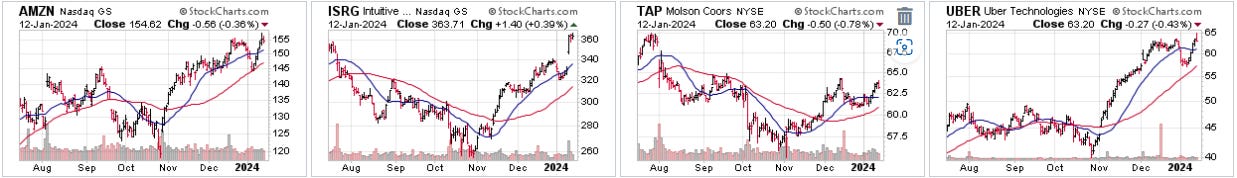
TAP - Molson Coors brewing saw a big boost about a year ago with the Bud Light PR Disaster. Company has a 2.59% forward dividend and will be reporting again February 13th.
UBER - Stock is breaking out on a multiyear basis and fighting its IPO price going back to 2019. With the recent addition to the S&P 500 the wind is at the back of the stock. Next earnings report will be in a few weeks in February. I have a short-term call spread in the name with 1/19 $60 calls and sold half at $64. Will roll, by Thursday if technical picture stays intact.
- Major Economic and FED speaker highlights for the week ahead -
Monday, January 15th - Martin Luther King Jr. Day - All markets closed.
Tuesday, January 16th
8:30 am NY Empire State Manufactuing Index (Jan) - Consensus -4.90 Prior -14.50
11 am Fed Waller Speaks
11:30 am 3/6-Month Bill Auction
Wednesday, January 17th
7 am OPEC Monthly Report
8:30 am Core Retail Sales (MoM)(Dec) - Consensus 0.2% Prior 0.2%
8:30 am Export Price Index (MoM)(Dec) - Consensus -0.6% Prior -0.9%
8:30 am Export Price Index (YoY) - Consensus ?? Prior -5.2%
8:30 am Import Price Index (MoM)(Dec) - Consensus -0.6% Prior -0.4%
8:30 am Retail Controls (MoM)(Dec) - Consensus ?? Prior 0.4%
8:30 am Retail Sales - Consensus 0.4% Prior 0.3%
9 am Vice Chair Barr and Bowman Speaks
9:15 am Industrial Production (YoY)(Dec) - Consensus ?? Prior -0.39%
9:15 am Industrial Production (MoM)(Dec) - Consensus -0.1% Prior 0.2%
10 am Business Inventories (MoM)(Nov) - Consensus -0.1% Prior -0.1%
1 pm 20-Year Bond Auction
2 pm Beige Book
3 pm FOMC Member Williams Speaks
4:30 pm API Weekly Crude Stock - Consensus ?? Prior -5.215M
Thursday, January 18th
7:30 am FOMC Member Bostic Speaks
8:30 am Building Permits (Dec) - Consensus 1.470M Prior 1.467M
8:30 am Initial Jobless Claims - Consensus 204K Prior 202K
8:30 am Continuing Claims - Consensus ?? Prior 1834K
8:30 am Housing Starts (Dec) - Consensus 1.415M Prior 1.560M
8:30 am Philly Fed Manufactuing Index(Jan)- Consensus -6.9 Prior -10.5
10:30 am Natural Gas Storage - Consensus
11 am Crude Oil Inventories(YoY)(Jul) - Consensus ?? Prior 1.338M
11:30 am 4-week/8-week Bill Auction
11:30 am FOMC Bostic Speaks
1 pm 10-year TIPS Auction
4:30 pm Fed’s Balance Sheet- Prior 8,139B
Friday, January 19th
10 am Existing Home Sales (Dec) - Consensus 3.83M Prior 3.82M
10 am Existing Home Sales (MoM)(Dec) - Consensus ?? Prior 0.8%
10 am Michigan-1-year Inflation expectations (Jan) - Consensus?? Prior 3.1%
10 am Michigan 5-year Inflation Expectations (Jan) - Consensus?? Prior 2.9%
10 am Michigan Consumer Expectations (Jan) - Consensus ?? Prior 67.4
10 am Michigan Consumer Sentiment (Jan) - Consensus 69.3 Prior 69.7
1 pm US Baker Hughes Rig Count
4:30 pm CFTC Various Speculative Net Positions
- Conclusion -
So, looking ahead, we have a slow economic start again this week, but by Wednesday we see some significant economic releases with Retail Sales showing us how well the consumers spending is holding up. The Philly Fed will give us a snapshot of the current conditions in the Northeast corridor, providing an update on the health of the manufacturing sector on Thursday. Wrapping up the week, we have to watch for existing housing sales on Friday at 10 am, which could be a catalyst for the end of the week. On top of that we have a few Fed speakers during the week to be aware of, but with the economic news on the milder side this week, and the Monday holiday. This week could very well be dictated by the trading action from last week.
My thought on the week ahead is we are likely to move to new highs on the S&P 500, which I would put these odds at around 67%, and outside a breakdown under $4730 to start the week. I will trade under this thesis and as of now I don’t see a reason to get into a more risk adverse trading stance. If last week was negative and didn’t so vehemently reject the previous week’s price action, I believe this would be a different story. That being said, the economic numbers with the bond markets pullback have left the door open to continued moves higher in equities over the next few weeks. At some point I expect to be pulling back significantly on my risk exposure, but that time is not now as the conditions improved materially week over week. For that reason, I will remain bullish and wait until new variables enter the equation to change or support my thinking.
Have a great week of trading, investing, and working. Be good.
Eric
Great overview!!!